kaltura-player-js
Debugging & Troubleshooting
In this section you’ll learn how to use debug mode to view explicit messages in the player to troubleshoot detected problems.
Table of Contents
Running the Player in Debug Mode
To debug the player and view explicit messages in the console, you’ll need to run the player in debug mode using one of the following options:
Option 1: Define a global window debug variable
In your application, define at the top of your page the following window debug variable:
window.DEBUG_KALTURA_PLAYER = true;
Option 2: Add a query string parameter to the page URL
In your page URL, add the debugKalturaPlayer query string parameter:
http://my/page/url?debugKalturaPlayer
Options 3: Using Player Config
var config = {
    ...
    log :{
        level: "DEBUG"
    }
    ...
};
var player = KalturaPlayer.setup(config);
About Player Logs
After implementing one of the options above, open your browser developer tools and look at the player logs, for example:
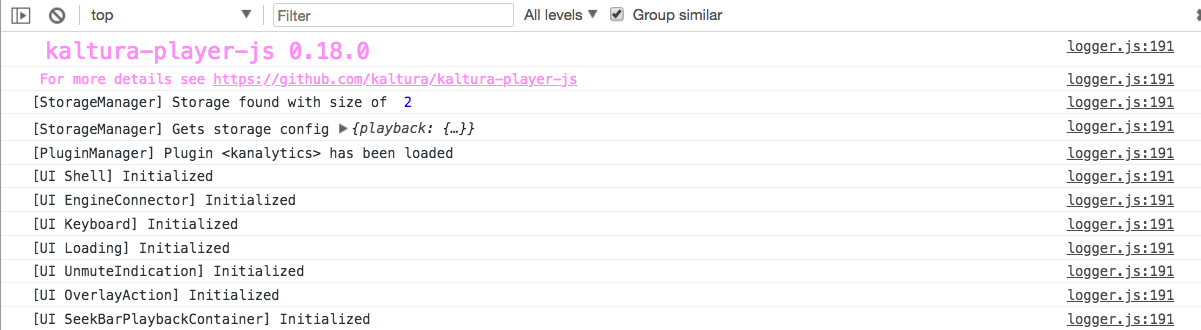
Log Conventions
As you can see from the figure above, the player log conventions are built with the following template:
[Component] Message
Note: Remember to stick to these conventions when building you application to ensure that debugging & troubleshooting are easy to understand.
Controlling the Log Level
If you want to use different log level than DEBUG, you’ll need to configure the player with the desired log level. For example, to display only logs from a warning level and above in the console, use the following:
var config = {
    ...
    log:{
        level: "WARN"
    }
    ...
};
For a complete list of log levels, click here.
Controlling the handler for debugging
Send console logs as network requests - good when you wanna recored them to a charles/fiddler session
var config = {
  ...
   log: {
     level: "DEBUG",
     handler: (msg, ctx) => {
        navigator.sendBeacon(`//myTest/
          ${encodeURIComponent(JSON.stringify(ctx.name + ': ' + Array.from(msg).join(), null, '  '))}`
        )}
     }
   }
    ...
Send console logs to textarea on the browser - good when you wanna debug the player in cases where devtools is not available
//create textarea html element and save ref to it in a var, in our example it is called "textAreaEl"
let textAreaEl = document.createElement('textarea');
textAreaEl.style.width = "100%";
textAreaEl.style.height = "300px";
document.body.appendChild(textAreaEl);
//helper method to get formatted timestamp
function msToTime(duration) {
  let milliseconds = parseInt((duration % 1000) / 100),
    seconds = parseInt((duration / 1000) % 60),
    minutes = parseInt((duration / (1000 * 60)) % 60),
    hours = parseInt((duration / (1000 * 60 * 60)) % 24);

  hours = hours < 10 ? "0" + hours : hours;
  minutes = minutes < 10 ? "0" + minutes : minutes;
  seconds = seconds < 10 ? "0" + seconds : seconds;

  return hours + ":" + minutes + ":" + seconds + "." + milliseconds;
}
function getCurrentTimestamp() {
  return msToTime(new Date().getTime());
}
var config = {
    ...
    log: {
      level: "DEBUG",
      handler: (msg, ctx) => {
        const text =
          ctx.name +
          ": " +
          Array.from(msg)
            .map(m => JSON.stringify(m, null, "\t"))
            .join();
        textAreaEl.value = getCurrentTimestamp() + ": " + text + "\n" + textAreaEl.value;
      }
    }
    ...
}